County List with Demographics
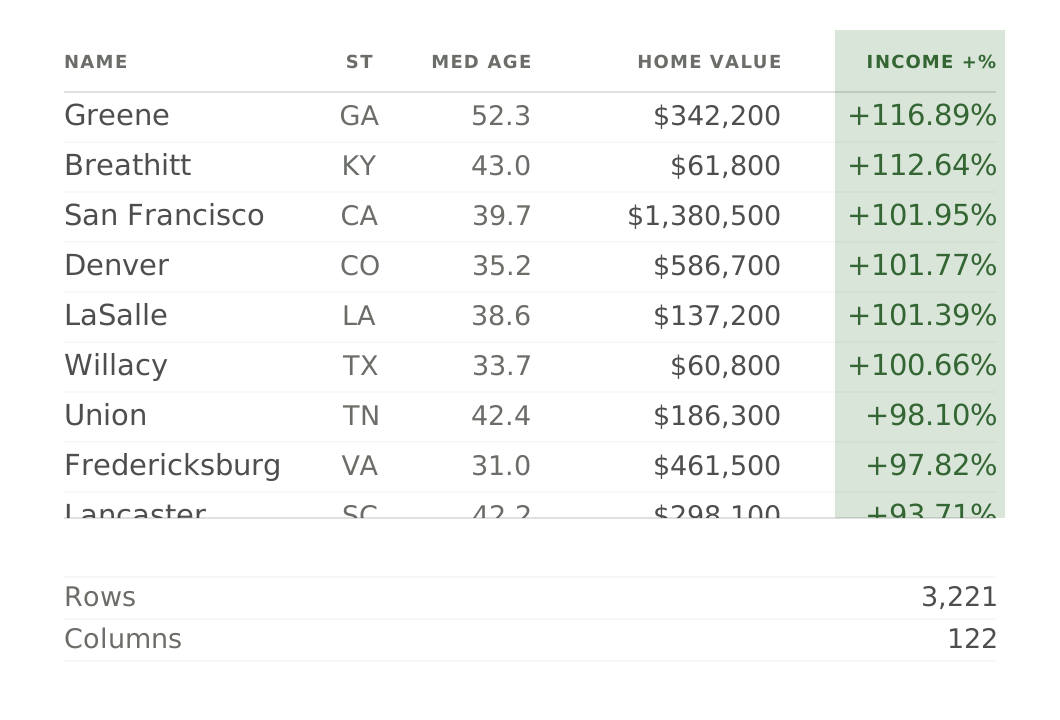
Every U.S. county with the deepest coverage we ship — full 10-year population trend, births, deaths and migration, the ACS demographic block, and HUD affordability.
Why teams buy the list instead of building one
Three reasons teams buy a dataset instead of building one.
Straight from the federal record
Every column traces to an official source — the U.S. Census Bureau, HUD, and the Department of the Interior. Compiled and cleaned, not scraped. Delivered as a spreadsheet the moment you check out.
A single-seat commercial license
Use it in personal, business, and commercial projects — no subscription, no recurring fees, no user limits, and no attribution required. Buy once; use it whenever.
Clean, and built to join
Consistent place names and FIPS keys mean it opens in Excel, Google Sheets, or any database and drops straight into your data. The City, County, and ZIP lists share those keys, so they join to each other too.
Every column in the file, typed and documented. Want to start building before you buy? Download a 100-row sample — the real database with real values, free to integrate against.
| CSV column | Type | What it represents |
|---|---|---|
| county_fips | text | 5-digit county GEOID (state + county FIPS). |
| county_name | text | County or county-equivalent name, cleaned (legal/statistical suffix removed). |
| state_name | text | Full U.S. state or territory name. |
| city_count | number | Number of localities (City-grain rows) that fall in the county. |
| zip_count | number | Number of ZIP codes in the county. |
| lat | number | County centroid latitude (interior point). |
| lng | number | County centroid longitude. |
| geohash_1 … geohash_8 | text | Progressive geohash prefixes from the centroid (8 columns). |
| elevation_ft | number | Centroid ground elevation. A single value across a county's wide elevation range — directional only. |
| land_area_pct | number | Land share of total area. |
| water_area_pct | number | Water share of total area. |
| timezone | text | IANA timezone from the centroid; a county spanning two U.S. zones is labeled by its single centroid. |
| cbsa_name | text | Core-Based Statistical Area the county belongs to. |
| population | number | Latest county population estimate (2024 vintage). Puerto Rico municipios are blank — they are not covered by the estimates. |
| population_5yr_ago | number | County population estimate from five years earlier. |
| population_change_5yr_pct | number | Percent change in population over the last five years. |
| population_10yr_ago | number | County population estimate from ten years earlier. Empty for Connecticut planning regions (series begins 2020). |
| population_change_10yr_pct | number | Percent change in population over the last ten years. |
| births | number | Annual births, latest year. |
| deaths | number | Annual deaths, latest year. |
| net_migration | number | Annual net migration, latest year. |
| median_age | number | Median age of residents. |
| median_household_income | number | Median household income, last 12 months USD. |
| per_capita_income | number | Per-capita income USD. |
| median_home_value | number | Median value of owner-occupied homes. |
| median_gross_rent | number | Median gross rent USD. |
| households | number | Occupied housing units. |
| housing_units | number | Total housing units. |
| home_ownership_rate | number | Percent owner-occupied. |
| population_density | number | People per square mile of land area (derived; water excluded). |
| education_bachelors_plus_pct | number | Percent of adults 25+ with a bachelor's degree or higher. |
| labor_force_participation_pct | number | Percent of the population in the labor force. |
| unemployment_rate | number | Percent of the labor force unemployed. |
| race_white_pct … race_multiple_pct | number | Percent by race across seven columns — White, Black, Asian, Native, Pacific, Other, and Two-or-more. A within-vintage snapshot, not comparable across the 2020 methodology change. |
| hispanic_pct | number | Percent Hispanic or Latino of any race. |
| poverty_rate | number | Percent below the federal poverty level. |
| avg_commute_minutes | number | Mean travel time to work in minutes. |
| income_limit_50pct_4person_2026 | number | Very-low-income limit (50% of area median income), 4-person household, USD. Representative of the full income-limit set shipped: 30% / 50% / 80% AMI × 1–8 person × FY 2021 + FY 2026 (48 columns total). |
| fair_market_rent_2br_2026 | number | Fair Market Rent for a 2-bedroom unit, USD. Representative of the full FMR set shipped: studio / 1–4 bedroom × FY 2021 + FY 2026 (10 columns total). |
| completeness_grade | text | A–F score of how fully the row's fields are populated (fitness-for-use, not accuracy). |
A UTF-8 CSV inside a .zip. It opens in Excel, Google Sheets, databases, BI tools, and any programming language.
Every dataset ships under a single-seat commercial license — use it in personal, business, and commercial projects. No subscriptions or user limits.
Annually, as the underlying federal releases publish. Your purchase is the current vintage at download time.
An instant, secure download link, valid for 30 days. No account required.
Because the data is delivered instantly as a download, sales are final. If a file is corrupt or incorrect, email us and we'll make it right.
Put every U.S. county
on the map.
3,221 counties with the columns you need — one clean spreadsheet. $199 one-time, instant download, single-seat commercial license.